This site uses cookies to improve your experience. To help us insure we adhere to various privacy regulations, please select your country/region of residence. If you do not select a country, we will assume you are from the United States. Select your Cookie Settings or view our Privacy Policy and Terms of Use.
Cookie Settings
Cookies and similar technologies are used on this website for proper function of the website, for tracking performance analytics and for marketing purposes. We and some of our third-party providers may use cookie data for various purposes. Please review the cookie settings below and choose your preference.
Used for the proper function of the website
Used for monitoring website traffic and interactions
Cookie Settings
Cookies and similar technologies are used on this website for proper function of the website, for tracking performance analytics and for marketing purposes. We and some of our third-party providers may use cookie data for various purposes. Please review the cookie settings below and choose your preference.
Strictly Necessary: Used for the proper function of the website
Performance/Analytics: Used for monitoring website traffic and interactions
2027 59,465 5.9% For the Class of 2027, only 4.4% Here’s the trend: UPenn Class Total Regular Decision Applications Regular Decision Acceptance Rate 2028 56,735 TBA 2027 51,465 4.4% For the Class of 2028, 8,500 students took the ED route, slightly up from the 8,000 who applied for the Class of 2027. for the Class of 2027.
Yale Medical School Acceptance Rate Trends Yale School of Medicine Class of 2027 Academic Profile Yale Medical School Admission Requirements How to Get into the Yale School of Medicine Yale Medical School Application Deadlines Frequently Asked Questions Takeaways What Is the Yale Medical School Acceptance Rate? for the Class of 2027.
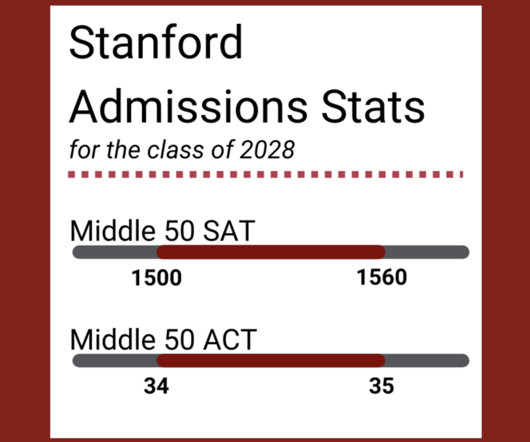
2027 39,644 4.5% Let’s break down what you need to focus on to boost your chances: Target GPA For the Class of 2027 , the average admitted GPA was a stellar 3.94 For the Class of 2027, the middle 50% of admits scored between 1510 and 1560 on the SAT, and 34 to 35 on the ACT. 2026 38,019 5.7% 2025 37,601 4.4% 2024 32,836 5.6%
2027 38,631 4.8% For the Class of 2027, the UChicago transfer acceptance rate was 7.9%. UChicago Acceptance Rate Trends If youre keeping an eye on UChicagos acceptance rate, youve probably noticed a clear trend. Its getting tougher to get in every year. 2026 37,522 5.4% 2025 37,977 6.5% 2024 34,372 7.3% 2023 34,900 5.9% 2022 32,291 7.2%
2027 52,303 4.5% 2027 44,559 3.5% Looking at the past decade, the Early Action acceptance rate has gradually dipped, mirroring the rise in applications across the board: Yale Class Total Early Action Applications Early Action Acceptance Rate 2028 7,856 9% 2027 7,744 10% 2026 7,288 11% 2025 7,939 10.5% for the Class of 2019.
2027 56,937 3.4% 2027 47,384 2.6% 2027 9,553 7.6% Just a few years ago, it was above 5%. For the Class of 2028, it’s down to a mere 3.6%. Let’s look at the numbers: Harvard Class Total Applications Overall Acceptance Rate 2028 54,008 3.6% 2026 61,220 3.2% 2025 57,435 3.4% 2024 40,248 4.9% 2023 43,330 4.5% 2022 42,749 4.6%
Let’s look at both schools’ historical data on acceptance rates: School Class Acceptance Rate Applicants Harvard University Class of 2024 4.90% 40,428 Class of 2025 3.40% 57,435 Class of 2026 3.20% 61,220 Class of 2027 3.40% 56,937 Class of 2028 3.60% 54,008 Oxford University Class of 2024 16.90% 23,020 Class of 2025 16.80% 23,414 Class of 2026 14.60% (..)
The Class of 2027 is the third class admitted under the policy, with the Class of 2025 being the first. However, compared to other Ivy League schools, Penn has experienced a slower growth rate in median SAT scores since enacting a test-optional policy.
This was actually a slight rise from the acceptance rate for the Class of 2027, when it was below 7%. There are fewer than 2,000 students, and the most recent first-year acceptance rate was just under 7.5%. Compared to this, the Early Decision acceptance rate across Early Decision I and Early Decision II is comparatively generous at 16%.
2027 13,136 412 3.1% For the Class of 2027 , only 7 students were admitted out of 174 hopefuls, and just 5 of those actually enrolled. Caltech Waitlist Acceptance Rate For the Class of 2027, 213 applicants were offered a spot on the waitlist, 199 accepted it, and not a single one was admitted. 2026 16,626 448 2.7%
For the Class of 2027, 2,111 out of 3,801 admitted students said, Im in, giving Northwestern a yield rate of 55.5%. 2027 52,233 7.2% 2027 47,212 5.6% 2027 5021 22.1% For the Class of 2027, 83 waitlisted students were admitted, while only 69 were accepted for the Class of 2026. 2026 51,558 7.2% 2023 40,585 9.1%
For the Class of 2027, UF got over 65,300 applications but only let in about 24%. The University of Florida lets you apply in two ways for the Class of 2027 and 2028: non-binding Early Action or Regular Decision. For the Class of 2027 , UF accepted 15,707 students, and 6,762 of them actually enrolledthats a 43.1% yield rate.
Nearly half of Stanford undergraduates benefit from need-based financial aid, and the average scholarship for the Class of 2027 was over $70,000. If your family earns under $100,000, you wont have to pay for tuition, room, or board. The financial aid process at Stanford is designed to work with your familys unique situation.
12 Vassar College (NY) (2027) 17.7% NEWS & WORLD REPORTS TOP 25 NATIONAL LIBERAL ARTS COLLEGES: ACCEPTANCE RATES Rank School Class of 2028 Acceptance Rate 1 Williams College (MA) 7.5% 2 Amherst College (MA) 9.0% 3 Swarthmore College (PA) 7.5% 4 United States Naval Academy (MD) ~8.0% 5 Bowdoin College (ME) 7.1% 5 Pomona College (CA) 7.1%
for the Class of 2027 , youll be competing against thousands of applicants with exceptional grades and impressive accomplishments. Stanford has a history of competitive acceptance rate over the past few years : Stanford Class Total Applications Overall Acceptance Rate 2027 53,733 3.9% With an acceptance rate of only 3.9% 2026 56,378 3.7%
Stanford holds back from releasing comprehensive admissions statistics, but the acceptance rates for both the Class of 2027 and the Class of 2026 were under 4%. They want students who are striving for something great. We hope this will spark your imagination and get your gears turning for where and how Stanford may fit into your future.
2027 31,059 7.9% 2027 28,106 7% 2026 28,718 7.7% 2027 2,953 16.5% Rice University Transfer Acceptance Rate According to Rice Universitys Common Data Set for 2023-2024 (Class of 2027), Rice Universitys transfer acceptance rate was 4.5%. Rices transfer acceptance rate for the Class of 2027 was 0.2%. 2026 31,443 8.7%
For example, for the Class of 2027, American University placed 7,312 (41%) of the 17,786 applicants for first-year admission on their waitlist. If you are asked to submit a final transcript, submit a final transcript. Only students who take the affirmative step of accepting their waitlist offer will be considered for admission. Only 18.7%
For the Class of 2027 , Cornell received 9,515 ED applications and admitted 1,670 students, resulting in an ED acceptance rate of approximately 17.6%. But Cornell received 9,515 Early Decision applications for the Class of 2027 and admitted 1,670 students, giving an ED acceptance rate of about 17.6%.
for Class of 2027) and STEM focus demand near-perfect scores. Note that a score of 5 on AP Calculus AB/BC, AP Chemistry, AP Physics 1/2/C, or 6/7 on IB Higher Level (HL) Math, Chemistry, or Physics can also substitute for missing high school courses, with documentation of unresolvable issues (ex: course unavailability at your high school).
AP Cyber: Networking and AP Cyber: Security Pilot 2025-2026 / National Launch 2026-2027 This first Career Kickstart two-course sequence in cybersecurity seeks to give students practical skills in safeguarding digital systems.
Class of 2027 17.9% Curious how the University of MIchigans acceptance rate has changed over the past few years? Heres a quick look: University of Michigan Class Acceptance Rate Class of 2024 26.1% Class of 2025 20.2% Class of 2026 17.7% Class of 2028 15.6% As you can see, the acceptance rate has steadily decreased over the past few years.
However, historically, the university admitted 3,843 students for the Class of 2027, 3,873 for the Class of 2026, and 4,453 for the Class of 2025. For instance, for the Class of 2027, the ED acceptance rate was 13.6%, while the RD acceptance rate was 11.1%. 2027 33,707 11.4% This was Carnegie Mellon’s highest yield so far.
While there is no minimum SAT score required, for the Class of 2027, the middle 50% range for admitted students who submitted SAT scores was 1520-1570. The more data Duke has, the better chance you have of showing them your strongest possible SAT performance. What does that mean for you?
However, based on what data they have released for both the Class of 2028 and the Class of 2027, the acceptance rate is less 4%. of the admitted first-years for the Stanford Class of 2027 were reported to have a legacy or donor tie. In recent years, Stanford has held back from releasing the most recent admissions data.
Class of 2027 29.1% For the Class of 2028, UT Austin received 68,931 applications and admitted 19,417 students , resulting in an acceptance rate of 28%. Heres how UT Austins acceptance rates have looked over the years: UT Austin Class Acceptance Rate Class of 2024 31.8% Class of 2025 31% Class of 2026 31.4%
UPenn SAT scores Here are the middle 50 percent SAT scores for students admitted to UPenn for the Class of 2027. Let’s look at what kinds of scores admitted students are submitting.
2027 109,350 41.9% While its not as selective as schools like UC Berkeley or UCLA , its still a tough school to get into, especially since more students are applying every year. Lets take a look at the numbers over the past few years: UC Davis Class Total Applications Overall Acceptance Rate 2028 98,861 42.1% 2026 110,189 42% 2025 105,850 49.4%
The application is also test-optional through the Spring 2027 term, so applicants in the 2025-2026 cycle do not need to submit ACT or SAT scores. Academic excellence is what UW-Madison cares most about on your application, and nearly all accepted students are in the top 50% of their graduating class in high school.
2027 28,353 12.4% 2027 17,190 10.5% Lets break Notre Dames REA acceptance rate down with some numbers: Notre Dame Class Total Early Action Applications Early Action Acceptance Rate 2028 11,498 15% 2027 11,163 15.2% For the Class of 2027, the acceptance rate was 5%, with 90 out of 1,811 waitlisted students gaining admission.
2027 10,693 5,802 54.3% 2027 113,578 10,693 9.4% They havent shared the transfer acceptance rate for the Class of 2028 yet, but for the Class of 2027, it was 37.2%, much higher than the first-year acceptance rate! For the Class of 2028, NYU proved to be a top choice, hitting a 60.4% 2026 12,539 6,184 49.3% 2025 12,380 6,097 49.2%
Class of 2027 11.7% While the rate bounced up slightly for 2027, its now at its lowest point in years at 11%. Here’s a quick breakdown: UC Berkeley Class Acceptance Rate Class of 2024 17% Class of 2025 14.7% Class of 2026 11.4% Class of 2028 11% As you can see, the acceptance rate has been on a steady decline.
2027 14,500 2,479 17.1% It rebounded a bit for the Class of 2027 at 17.1% 2027 13,377 2,029 15.2% Things improved slightly for the Class of 2027, with a 15.2% 2027 1,123 450 40.1% Since then, the numbers have dipped a bit, with the Class of 2026 at 40.5%, Class of 2027 at 40.1%, and Class of 2028 at 38.3%.
For the Class of 2027, 53,733 students applied, but only 2,099 were admittedthats just a 3.9% The Stanford Interview Process Common Stanford Interview Questions How to Prepare for a Stanford Interview Frequently Asked Questions Takeaways Does Stanford Interview All Applicants? Lets be real: Getting into Stanford is incredibly hard.
Class of 2027 13.1% If youre curious about how Harvey Mudds acceptance rates have shifted over recent years, heres a quick breakdown: Harvey Mudd Class Acceptance Rate Class of 2024 9.9% Class of 2025 10% Class of 2026 13.4% Class of 2028 12.7% See the trend? While rates fluctuate slightly, Harvey Mudd remains highly competitive.
Scores Vanderbilt is remaining test optional through 2027 , but that does not mean you shouldnt submit. And for those in the bottom half and quarter, were willing to bet those were absolutely not legacy students they were probably student athletes.
2027 11,924 5.7% 2027 14,990 3.8% Yeah, its tough, but if youre dreaming of MIT, dont let that number scare you. Heres a quick look at the Early Action acceptance rates over the past few years: MIT Class Total EA Applications EA Acceptance Rate 2028 12,563 5.3% 2026 14,781 4.7% 2025 15,036 4.8% 2024 9,291 7.4% 2026 19,195 3.3%
Class of 2027 9.4% Want to see how NYUs acceptance rates have changed over time? Heres a quick breakdown: NYU Class Acceptance Rate Class of 2024 21.1% Class of 2025 13% Class of 2026 12.5% Class of 2028 8% With the acceptance rate steadily decreasing, getting into NYU has become more challenging.
for the Class of 2027, 8% for the Class of 2028, and 7.7% for the Class of 2027, 11.5% for the Class of 2027, 11.5% for the Class of 2029. NYU is getting more selective each year as more students apply.</span></li> for the Class of 2028, and 10.5% for the Class of 2029. .</span></li>
Class of 2027 7.7% For the Class of 2027, Rice University received 2,953 Early Decision applications and admitted 486 students, giving ED applicants an acceptance rate of about 16.5%. Heres how Rice Universitys acceptance rates have looked in recent years: Rice University Class Acceptance Rate Class of 2024 8.7% Class of 2028 7.5%
for the Class of 2027, and 8% for the Class of 2028. for the Class of 2027, and 10% for the Class of 2028. .</span></li> for the Class of 2027, and 10% for the Class of 2028. for the Class of 2026, 9.4% That shows a steady decline, as the number of applicants has increased.</span></li>
For the Class of 2027, Penn admitted 72% fewer students off of the waitlist than the previous year, which highlights the role of yield rate in waitlist outcomes. If you are reading this you were probably waitlisted by Penn, or are trying to plan ahead just in case thats how things work out. Either way, were here to help.
We organize all of the trending information in your field so you don't have to. Join 5,000+ users and stay up to date on the latest articles your peers are reading.
You know about us, now we want to get to know you!
Let's personalize your content
Let's get even more personalized
We recognize your account from another site in our network, please click 'Send Email' below to continue with verifying your account and setting a password.


Let's personalize your content