This site uses cookies to improve your experience. To help us insure we adhere to various privacy regulations, please select your country/region of residence. If you do not select a country, we will assume you are from the United States. Select your Cookie Settings or view our Privacy Policy and Terms of Use.
Cookie Settings
Cookies and similar technologies are used on this website for proper function of the website, for tracking performance analytics and for marketing purposes. We and some of our third-party providers may use cookie data for various purposes. Please review the cookie settings below and choose your preference.
Used for the proper function of the website
Used for monitoring website traffic and interactions
Cookie Settings
Cookies and similar technologies are used on this website for proper function of the website, for tracking performance analytics and for marketing purposes. We and some of our third-party providers may use cookie data for various purposes. Please review the cookie settings below and choose your preference.
Strictly Necessary: Used for the proper function of the website
Performance/Analytics: Used for monitoring website traffic and interactions
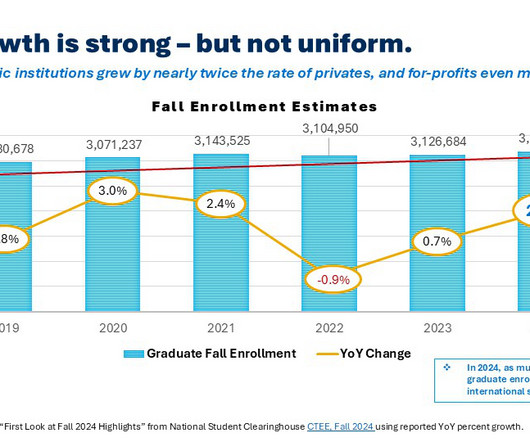
Undergraduate enrollment did well Before we address graduate trends, lets talk about the preliminary Fall 2024 undergraduate data recently released by National Student Clearinghouse (NSC). While first-year student enrollment contracted by 5 percent overall (and as much as 8.5 a less interesting place in which to enroll.
What is the long term impact of the pandemic on graduate enrollment? I wanted to hold off providing an answer until we have the 2021 academic year data, knowing that the real answer will only come with a few more years of enrollment trend data. Source: RNL Analysis of IPEDS Fall Enrollment Snapshot data.
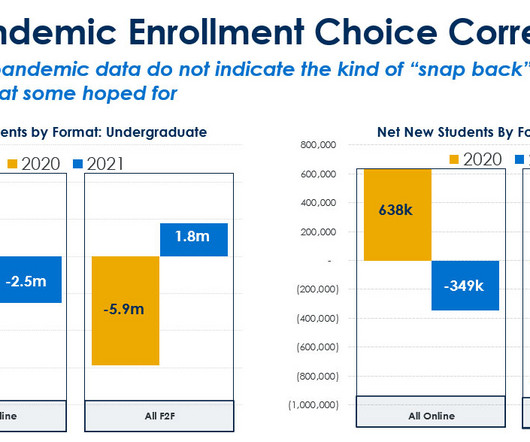
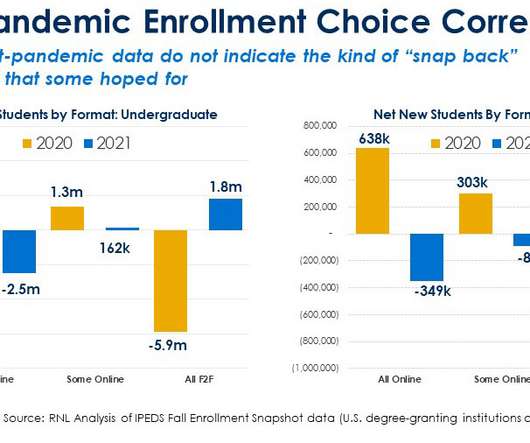
The fall enrollment snapshot that we have relied on is undercounting online student by 75 percent among undergraduates and 44 percent among graduate students. Here’s what we found: Undergraduate : Among undergraduate students enrolling in all formats of study, fall snapshot data undercount total enrollment by 34 percent (missing 5.6
million undergraduates made the decision to enroll in all face-to-face (F2F) classroom students in 2021, after 5.9 A number of these students enrolled in the “some online” category, but others did not return, leading to a continuation of the contraction in undergraduate enrollment. million students in 2019.
Please welcome the Denver Christian School team to Enrollment Catalyst! DCS has experienced exponential growth over the past several years, increasing from 565 students in 2019-20 to 865 students in 2022-23. Dr. Rick Newberry conducted a three day site visit in February 2023 to begin his Enrollment Catalyst Program with their team.
UPenn yield rate The yield rate tells you how many admitted students actually enroll. 2019 37,267 9.9% Applications have nearly doubled, jumping from 37,267 for the Class of 2019 to a record 65,235 for the Class of 2028. 2020 33,156 7% 2019 31,778 7.5% Back in the Class of 2019, it was still hovering around 7.5%.
According to a 2021 RNL survey of more than 100 graduate marketing leaders , between 2019 and 2021 the average digital marketing spend doubled. Digital marketing is not hard, but executing a strategy that drives enrollment (the only stage that generates revenue) is challenging. This reality was not surprising. 6 percent).
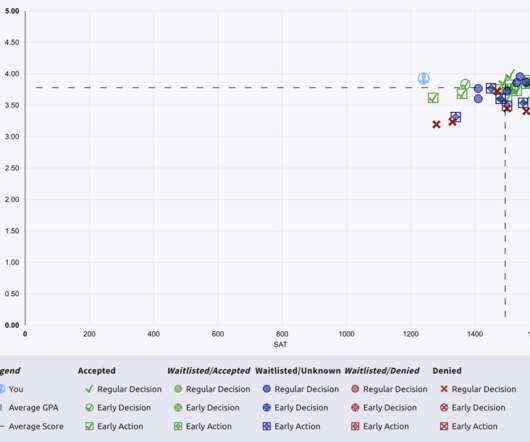
Median SAT scores have increased for all Ivies after test-optional policy implementation Compared to the drop in test score submission, Penn’s median composite SAT score has increased steadily since 2017 for enrolled first years, increasing nine points per year on average.
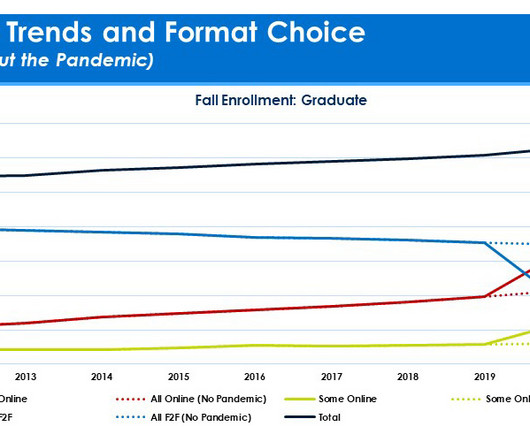
Their IPEDS snapshot data showcase how many students were enrolled in different types of programs on a given fall semester day. While these are important data, I have previously written that the best data on format preferences reflect enrollment over the full 12-month academic year. Undergraduate In 2022 more than 2.2
Im sure some of those views were heightened by the pandemic and the uncertainty surrounding college enrollment at the time. So, lets take another stab at this with the pandemic-aspect removed and a bit more stability in the college enrollment world. What does being deferred mean? in History, Technology, and Society.
I have seen their explosive enrollment growth and outstanding work. I hope you enjoy this interview with: Yohana Hill, Chief Advancement Officer Mark Sherrod, Director of Marketing Laura Aldag, Director of Enrollment Let’s begin with some background on your enrollment growth over the past five years or so.
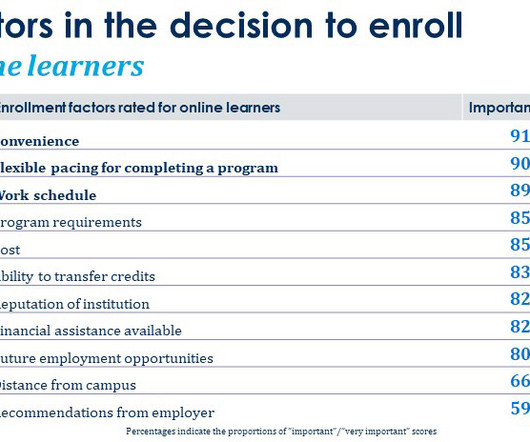
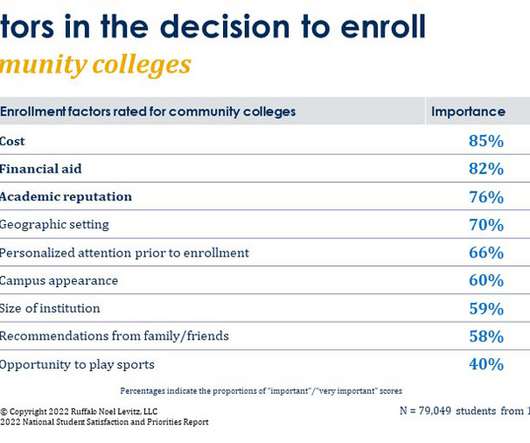
This is valuable information for recruitment and enrollment leaders to consider in informing how to position your institution in marketing materials. Enrollment factors for graduate students In the survey, students are asked to indicate the level of importance they assign to a variety of potential factors in their decision to enroll.
A) Colleges need to manage their enrollment. This delicate calculation is the job of a college’s enrollment manager. Some colleges might have over-enrolled or under-enrolled last year or for more than one year, so they need to take fewer or more students overall this year. So what does this all mean?
Make a push during 12 th grade The last year of high school is a key year for students and a great opportunity to make an enrollment connection with students from Hispanic families. Talk with our enrollment experts and find out how you can provide the information they need to get excited about your institution and move toward enrolling.
Phil Hill : A big part of writing both the blog on the 2019-20 data and the 2020-21 data blog (on the need to focus on 12-month unduplicated enrollment rather than fall snapshot) was to point out how much we’ve needed this type of data. Here is an abridged summary of our conversation.
In 2019-20, nearly three-quarters of applicants sent colleges assessment results.” • Also, according to this article , “These trends follow a significant number of colleges switching to test-optional policies, which is reflected in the Common App data. Colleges are using AI algorithms to determine whether a student they accept will attend. •
That means out of 2,146 admits, 1,554 actually enrolled. for the Class of 2019. 2019 30,236 6.7% 2019 25,543 5% For perspective, applications nearly doubled between the Class of 2019 and the Class of 2028—from 25,543 to a staggering 46,609. 2019 4,693 16.1% for the Class of 2028 was a hefty 72%.
Institutional choice In addition to gathering student demographic indicators such as class level, enrollment status, race/ethnicity, etc., Are you highlighting the voices of currently enrolled students on why your college is the best fit, the best choice, the best value?
43% of high school completers immediately enrolled in 4-year institutions and 19% immediately enrolled in 2-year institutions. Currently, according to the National Center for Education Statistics, roughly 62% of all high school graduates attend college. THIS IS AMAZING AND SHOULD BE APPLAUDED.
Northwestern yield rate Lets dive into Northwesterns yield ratethe percentage of admitted students who actually enroll. Northwestern is likely to prioritize applicants who demonstrate genuine interest, increasing the chances that accepted students will actually enroll. 2019 32,096 13.1% 2019 32,096 13.1% 2019 29,471 11.2%
Skip to content Enrollment is now open for the 2025-26 Academic Year Summer Tutoring Programs College Counseling Packages Contact Us Search Instagram-square Facebook Linkedin Youtube Yelp Why Marks?
When highly selective colleges admit fewer students, it trickles down and puts pressure on selective and less selective colleges as those denied students are looking for places to enroll. A Diversified class of students Enrollment Management Full and Successful athletic teams, bands, choirs, debate teams, and theater productions.
While the November blog indicated that Snapshot Data undercounted total enrollment by nearly 6 million students in 2019 (the last pre-pandemic year), I didn’t go too far into where these missing students were hidden. This can all be found when you look at those enrollment differences by instructional format chosen by students.
colleges and universities have seemingly recovered from the pandemic-era lull in international enrollments, a new report found. It's the first time that international enrollments surpassed the 1 million mark since the 2019-20 academic year, essentially showing a rebound to pre-pandemic norms. increase from the year prior.
College officials call this demographic phenomenon the "enrollment cliff." Enrollments have been dropping for a decade and cratered during the COVID-19 pandemic. To make matters even worse, a dangerous precipice looms on the near horizon, a demographic phenomenon known as the enrollment cliff. What Is the Enrollment Cliff?
Students must be Texas residents, enrolled full-time, submit the FAFSA and/or TASFA, and demonstrate financial need. Today, we’re breaking down recent news surrounding UT Austin’s auto-admission policy and UT tuition coverage, including how these shifts may impact you!
We classify highly selective colleges as admit rates of 20% (the Common App classifies them as under 25%); that number of colleges has grown from 62 in 2019 to 71 in 2024. They simply benefited from certain factors and from enrollment management. For several years running, admit rates have gone way down.
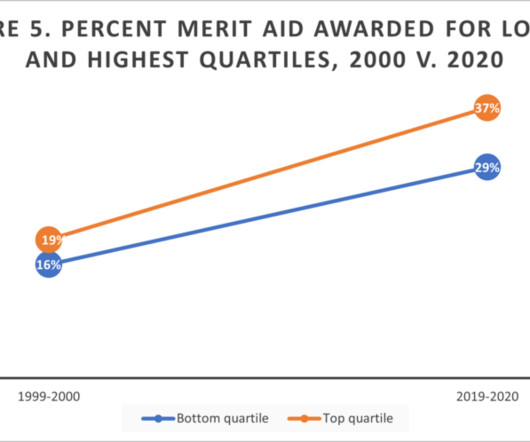
By Don Heller, Gigi Jones, and Abby Miller The recent dismantling of affirmative action and the COVID pandemic highlighted the barriers preventing underserved, underrepresented students – students of color and those who are low-income and first-generation – from enrolling in college. Source: U.S.
Skip to content Enrollment is now open for the 2025-26 Academic Year Summer Tutoring Programs College Counseling Packages Contact Us Search Instagram-square Facebook Linkedin Youtube Yelp Why Marks?
of admitted students said yes to UChicago, with 1,726 out of 1,955 admits choosing to enroll. 2019 30,162 7.8% Schools love ED applicants because it helps them predict enrollment and boost their yield rates. Summer enrollment. The odds depend on how many people actually enroll, which can vary wildly from year to year.
Stanford yield rate Yield rate refers to the percentage of admitted students who decide to enroll, and for the Class of 2027, Stanford’s was an impressive 80.9%. Here’s a snapshot of the numbers from the Class of 2019 through the Class of 2027: Stanford Class Total Applications Overall Acceptance Rate 2028 TBA TBA 2027 53,733 3.9%
Aaron Basko This is a guest blog from Aaron Basko , vice president for enrollment management at Lynchburg Universit y. Aaron is a higher education professional with more than 25 years of experience in enrollment management. percent between 2015 and 2019.” After all, individually, the may not look like much on paper.
California State University reported an enrollment decline of 6.5% between 2019 and 2022. Only four of the 23 campuses in the CSU system recorded enrollment growth from 2019-2022. The CSU recorded an enrollment decline of 6.5% between 2019 and 2022, according to a report from the Campaign for College Opportunity.
That’s when the school reached out to Enrollment Resources. The school had high expectations when their new website went live. Their marketing agency at the time poured additional budget into their existing brand awareness campaigns on TV, radio and digital. Expenses were up. Leads were low.
132% Improvement in Overall Enrollment 617% Increase in Paid Search Leads 154% Increase in Website Lead Conversion Valley College Valley College is a multi-campus school that offers career education at 5 physical campuses throughout West Virginia and Ohio as well as Online programs.
Enrollment at Wisconsin technical colleges increased by 10.3% Enrollment fell sharply during the earlier days of the pandemic. Enrollment has largely been on the decline at Wisconsin technical colleges over the past decade. Overall, enrollment in the system increased to 274,203 for the 2021-2022 school year, a 10.3%
The number of applications has risen by about 12,500 since the 2019-20 admissions cycle. According to a survey done by enrollment management firm Maguire Associates, these policies have also helped increase application numbers from low-income students and from students who belong to marginalized racial and ethnic groups.
Undergraduate enrollment has increased since 2017. In 2017, Yale opened Pauli Murray and Benjamin Franklin colleges to expand the undergraduate population and admit upwards of 200 additional students every admissions cycle, bringing total undergraduate enrollment from 5,400 to 6,200 in 2023.
Blogs Improve the precision of student enrollment forecasting January 31, 2023 Jeff Pidcock Director of Budgeting and Business Transformation, Miami University The views and opinions expressed are those of the author and do not necessarily represent the views or opinions of EAB. Interested in the Rising Higher Education Leaders Fellowship?
Many colleges talk about how their enrollment tactics change when their yield rate is higher than their acceptance rate. This article is old but shows that even in 2019 before things got significantly more competitive, CS admissions were often way harder than general admissions to the same university.
Pennsylvania's registered nurse vacancy rate jumped 10 percentage points from 2019-2022. Between 2019 and 2022, the registered nurse (RN) state vacancy rate jumped from 20.5% We have been fortunate not to see a decline in our enrollment within the nursing program at Commonwealth University. HealthCare Labor Market study.
Why personalization is essential to student recruitment In data from our 2024 Enrollment Survey, we found that on average students apply to at least 8 colleges thats double the amount in 2019. Providing personalized interactions can be the differentiator that influences a student’s enrollment decision.
As we close the chapter on 2024, its a perfect time to reflect on lessons learned about the ever-changing landscape of college admissions and enrollment. With students applying to an average of eight colleges double the number in 2019 the competition for attention has never been fiercer.
We organize all of the trending information in your field so you don't have to. Join 5,000+ users and stay up to date on the latest articles your peers are reading.
You know about us, now we want to get to know you!
Let's personalize your content
Let's get even more personalized
We recognize your account from another site in our network, please click 'Send Email' below to continue with verifying your account and setting a password.


Let's personalize your content