I’m sick of this crap. To reiterate, I don’t care about tests, other than to point out repeatedly the essential absurdity of the very concept. Use them if you want, Love them if you want. I work at a university that doesn’t require them, and I work on the west coast, where they’re essentially meaningless. I’m retiring in three years, so I’ll never have to deal them again.
But I do hate bullshit.
But of course the debate goes on, and now people (most people who who historically have benefitted from tests) are jumping back on the testing bandwagon. And some of them, including the student newspaper at Harvard, are saying that test-optional policies don’t increase diversity. Two points here: No one ever said things would change dramatically over night, and I’m looking at data that suggests otherwise. (Admittedly, the Crimson has 2023 data, and that might change my perspective; however, I’m not so obsessed as to collect data manually from a bunch of colleges to do the analysis. For now, we have IPEDS, which goes to 2022.)
Before I show the data here, one important point: We cannot tell from federal data who was admitted; only who enrolled, and if you’re going to talk about changes, we’d really need to know the former as well as the latter. In fact, the former might be more important in the discussion than the latter. I’ve been doing this for 40 years, and one thing I can tell you without the fear of any contradiction is that yield rates (the percentage of admitted students who enroll) vary by region, income, ethnicity, parental attainment, and several other factors; on top of this, the motivation of 18-year old high school students (especially when mixed with their parents’ emotions) is not always confined to the rational.
Additionally, the highly rejective colleges don’t start from zero when admitting students. Some substantial number of slots is spoken for, or essentially spoken for, before review starts: Athletes, children of alumni, and the relatives of big donors all get in line first. The number of slots the admission office has total discretion over is limited.
Anyway, on to the data. I looked at this in four big chunks: Ivy and Ivy-plus (all eight Ivy League institutions plus MIT, Stanford, Chicago, and Duke); public land grants created under the Morrill Act of 1862; public flagships; and a category I’m calling “test-friendly”; that is, colleges that either kept testing during the pandemic, or those who still expressed a strong preference for tests even during COVID, and those that quickly returned to them after the pandemic subsided. These include Florida publics, the two biggest Georgia publics, Purdue, Tennessee, and Georgetown.
In doing this analysis, I looked only at US citizens or permanent residents who had a known ethnicity. I took out international students and those who did not check any box on the application. Then I combined the students into three groups: White, Asian, and Underrepresented Students of Color (URSOC so I could fit the labels on.) I ran back to 2015, and looked at the data in four grids: One with all three groups, as numbers and as percentages of totals, and one with just White and URSOC as the base, also as counts and parts of the whole. Counts and percentages are important, because 2021, the first year of widespread test optional policies, saw bigger enrollments, driven by deferrals from 2020).
The bottom portion of every display removes Asian students, and just compares White students to URSOCs. Why? Because every time I do something like this, some says either a) I should include Asian students in the URSOC group, or b) I should not look at Asian students because they’re overrepresented, or c) I should include Asian in the group with White students. So, to make everyone a little less happy (my goal in life) I did it this way.
I’ve not put these breakouts on my other blog, Higher Ed Data Stories, but may do so later.
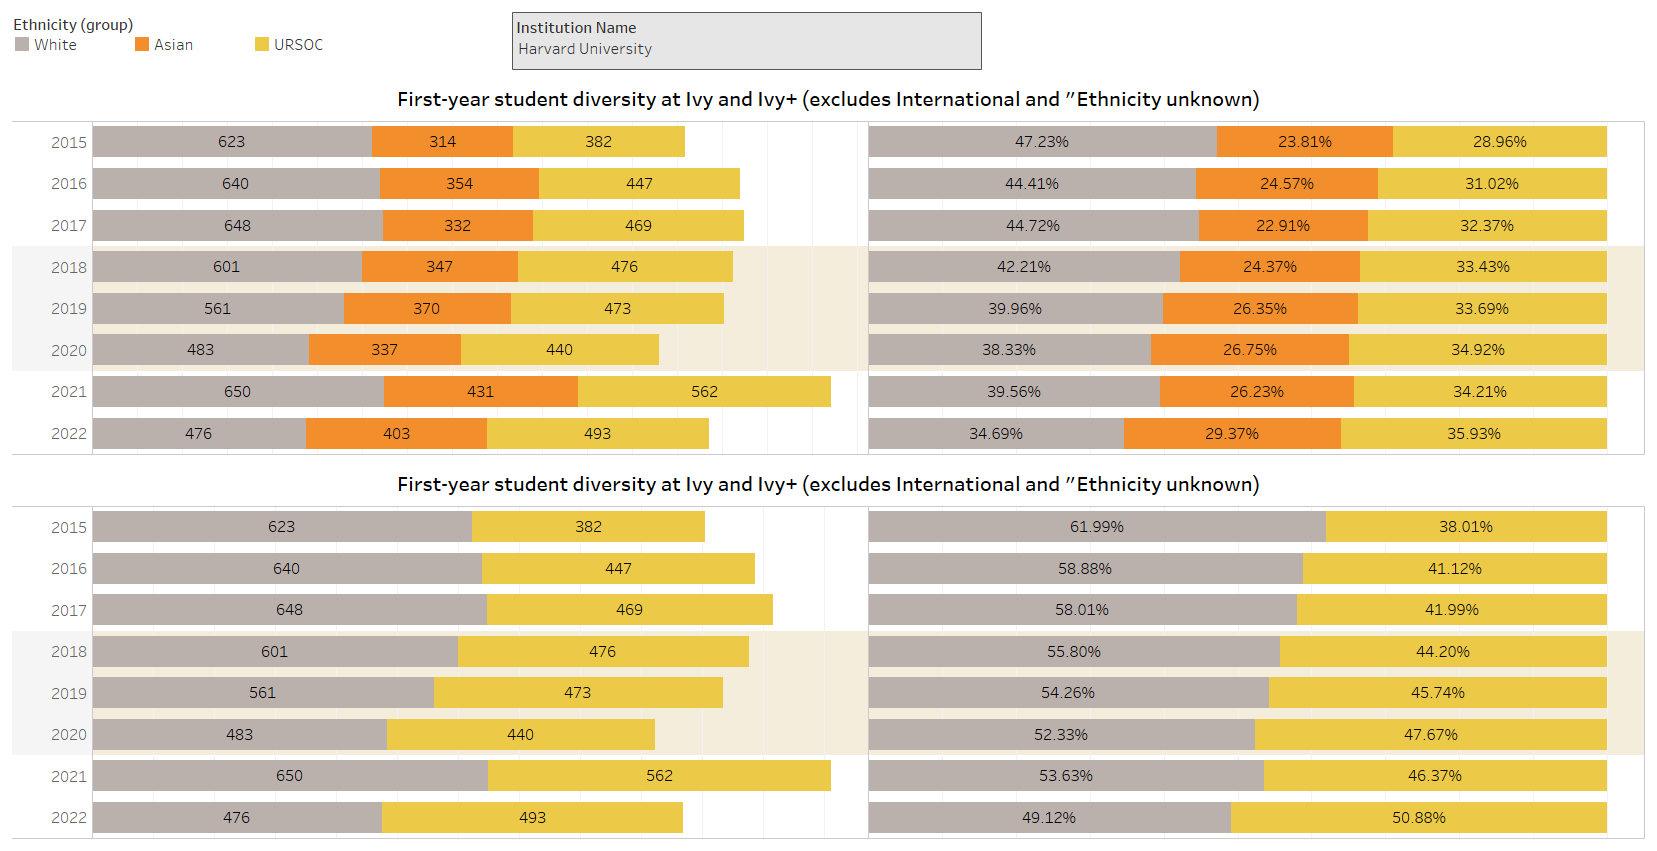
So, with that context, here you go. Ivy and Ivy Plus institutions. Click to see larger:

And although I hate doing this, here is just Harvard. What I see on both of these is big gains in URSOCs in both numbers and percentages. Taking out the anomalous 2021 year, those numbers and percentages increase by a non-trivial amount. And the growth in Asian students, almost certainly an effect of the lawsuit, may have limited even greater growth.
Looking at these institutions is important, and especially important in light of that old study that always gets kicked around that studied some small number of small liberal arts colleges and leapt to the conclusion that test optional policies don’t increase diversity. If you really want to look at this, you should, I think limit yourself to those institutions that have the application volume to shape and mold their class. While those institutions were selective 20 years ago, they were not that selective.
Even so, I believe test-optional policies send a message to historically underrepresented groups, and as one (not the) element of initiatives designed to increase campus diversity, they’re an important component of that strategy. They should never be expected to carry the full load themselves.
What about institutions that don’t “select” but mostly “admit” qualified students who apply for admission? It’s unfair to lump all land grant and flagships into that category, but take a look at them, too. (By the way, I used the 1862 land grants because the two later groups are generally HBCUs and Tribal Colleges, with historic missions to serve underserved students.) Again, look at both raw numbers and percentages:


And finally, what about those test friendly institutions? Take a look.

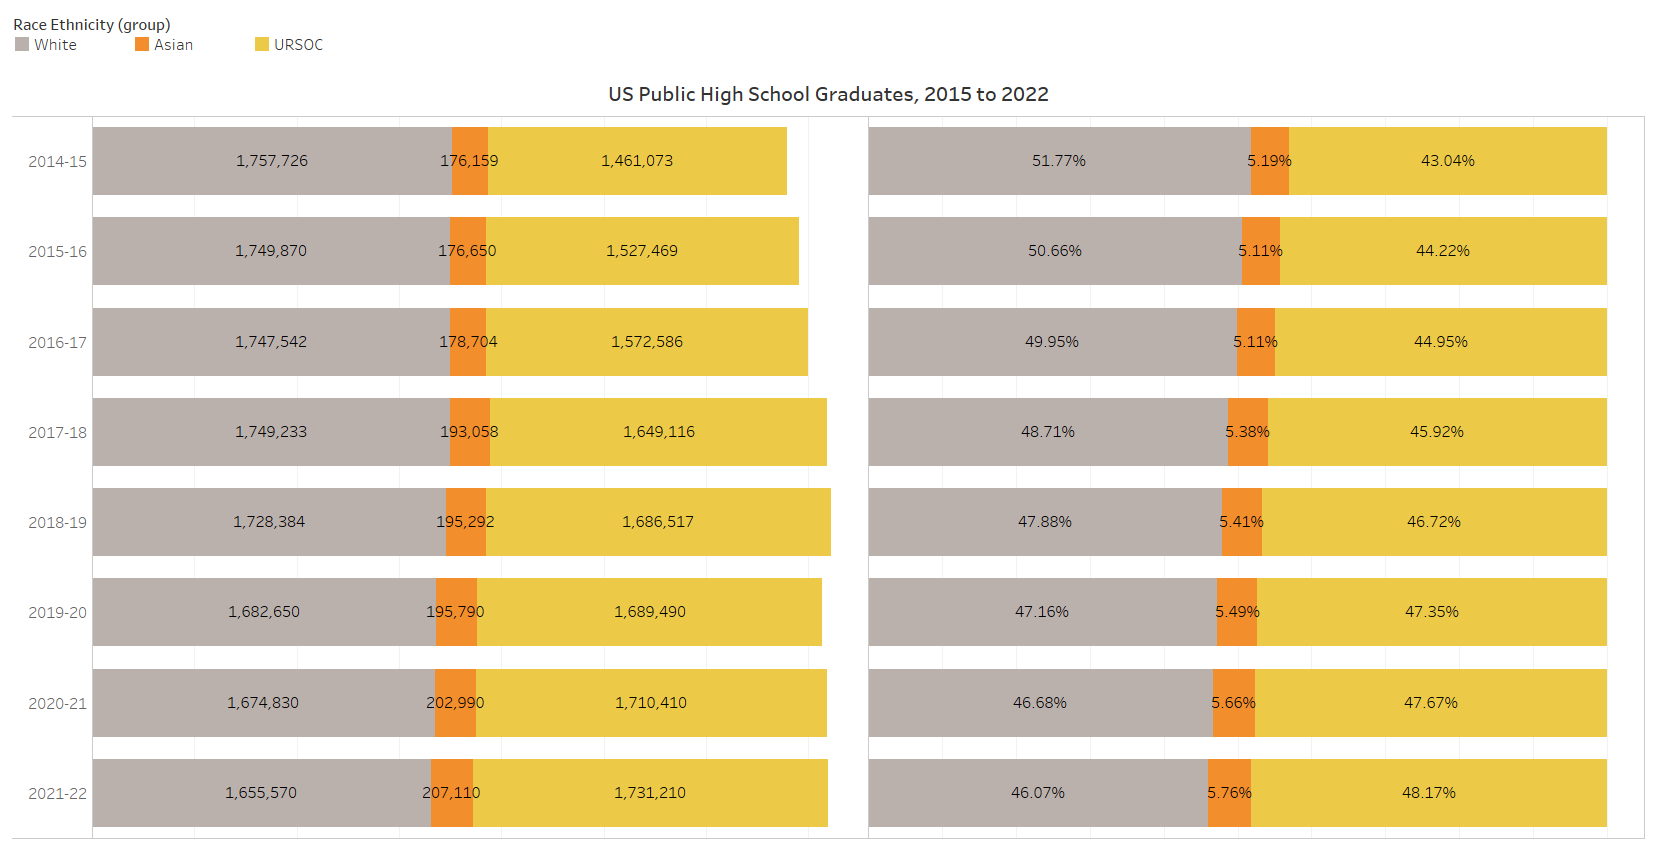
Finally, to show you how far we have yet to go, here is WICHE data on public high school graduates over this same period. (Private high schools add about 10% to these numbers, but WICHE does not break them out by ethnicity).
Draw your own conclusions. And check back in a year, when the debate will continue. Until then, that’s all I’ll have to say about this subject.

Jon, I woke up to your snark, and it’s a breath of fresh air. I’m bummed that I have to wait a whole year for the next one, but I’m not sure you’ll be able to bottle that stuff inside for that long, and it’s not healthy to do that.
Even with the Leonhardt article, I think the pushback has been pathetic, and much less than I had anticipated. I’m guessing Brown and a dozen or two others will revert next cycle, which is still a trickle. I know your feelings about the Ivy+, but I don’t think reversions will matter unless it includes a critical mass of Ivy+.
Had you asked me in 2020 the number of reversions 3-4 years later out of the 800+ COVID-driven additional test optionals (and test frees) given a vaccine and relatively safe test administrations, I would have said a couple hundred, and I would have considered that optimistic. I think folks just like test optional, as I had hoped they would, and now that inertia has taken hold, reverting is harder than continuing. It would be great if I’m on the high side on the couple dozen estimate I have for next cycle.
Time to prognosticate, my friend – for 100 points, how many will revert next cycle?
Thanks,
Jay
LikeLike